
Introducing ΔiVB⁺: A Context-Adjusted Induced Vertical Break Metric
Measuring vertical pitch movement against expectation.

Introduction
Baseball and data have become inseparable.
While every major sport has undergone an analytical revolution over the last two decades, baseball remains at the forefront. The game’s discrete, pitch-by-pitch nature creates an environment where nearly every action can be measured, modeled, and studied.
That doesn’t mean baseball is stripped of personalities, intuition, or feel. Far from it. Data can describe the game without fully replacing the human judgment required to play, scout, teach, and understand it.
But at its core, baseball is a game built on physics, probabilities, and thousands of measurable interactions occurring over the course of a season.
One area that has received increasing attention throughout the 2020s is pitch movement.
More specifically: induced vertical break (iVB).
For those unfamiliar, induced vertical break isolates the vertical movement produced by spin after removing the expected effect of gravity. A fastball with higher iVB appears to “stay up” longer, often creating the visual illusion of rise as it approaches the plate.
Over the past decade, organizations have increasingly targeted 4-seamers with good ride characteristics. High-riding four-seamers have become a key part of modern pitch design, particularly when strong movement is paired with velocity, a compatible release profile, and the command to use it effectively.
Last December, I examined a simple question: Does induced vertical break actually matter?

Across a league-wide sample of four-seam fastballs, the answer was fairly straightforward: more ride generally correlated with better outcomes, including higher whiff rates and weaker contact quality.
But that study left me with another question I wanted to tackle.
If ride matters, are we evaluating it correctly?
Raw iVB is influenced by numerous factors, including:
Stuff: velocity, vertical approach angle (VAA), horizontal break
Spin characteristics: spin rate, spin axis
Release geometry: release position, arm angle, extension
A pitcher generating 18 inches of induced vertical break is usually viewed as possessing an elite fastball characteristic. But should 18 inches mean the same thing for every pitcher?
What if one pitcher generates that movement from a high release slot with elite velo, strong spin characteristics, and good extension?
What if another pitcher generates the same movement from a lower arm slot with less favorable physical characteristics?
The output is identical.
The context is not.
Evaluating movement without considering those inputs can obscure what a pitcher is actually generating.
These questions helped form the foundation for ΔiVB⁺.
Given a pitcher’s physical characteristics, how much induced vertical break should we expect?
And once we establish that expectation:
How much is the pitcher overperforming or underperforming it?
That is the purpose of ΔiVB⁺: a context-adjusted metric designed to measure ride relative to expectation, rather than raw output alone.
The Paul Skenes Paradox

One of the main player-level examples I had in mind throughout this project was Paul Skenes.
Before Skenes debuted in the majors, the public discussion around his fastball centered on a tension point: the velocity was obviously elite, but the raw induced vertical break was not.
That made him a fascinating test case. Eli Ben-Porat (EBP) explored this in his Substack article a couple of years ago.

On one hand, Skenes had the kind of velocity that typically reduces the quality of contact for hitters. On the other hand, his four-seamer shape sat firmly in what is often called the “dead zone.” It did not fit the clean public template of a good “riding” fastball. The shape raised real questions: if the pitch was sitting near triple digits but only generating around 12–13 inches of induced vertical break, was that a problem?
Some analysts argued that the fastball shape was a legitimate concern. Others pushed back, pointing out that velocity, command, release traits, location, and the rest of the arsenal all mattered too.
That debate is exactly why raw iVB doesn’t fully capture context.
Skenes was interesting because I wanted to know whether his seemingly low raw iVB was actually low for a pitcher with his physical profile.
In other words:
Was he failing to maximize vertical ride on his 4-seamer?
Or was raw iVB evaluating him against the wrong baseline?
ΔiVB⁺ is centered like a traditional plus metric:
100 = league average ride relative to expectation
115 = roughly one standard deviation above expectation
85 = roughly one standard deviation below expectation
So when a pitcher grades around 100, that does not mean the fastball is average overall. It means the pitch is generating about as much ride as expected given its physical profile.
As an aside, unless otherwise noted, all ΔiVB⁺ values in this article are calculated using 2025 Statcast data, the most recent completed MLB season when this project began.

Well, well, well. As it turns out, Mr. Skenes’ mediocre-looking iVB numbers were not poor at all. They were almost exactly where they should have been given the context of his 4-seamer.
That was a really fun realization for me, I was actually half-hoping that the expected would’ve been something even more absurdly low like in the single digits, and would’ve shown that Skenes was actually an alien, but this was still cool analysis.
The raw iVB looked low.
The context-adjusted number said it was almost perfectly normal.
Building Expected iVB
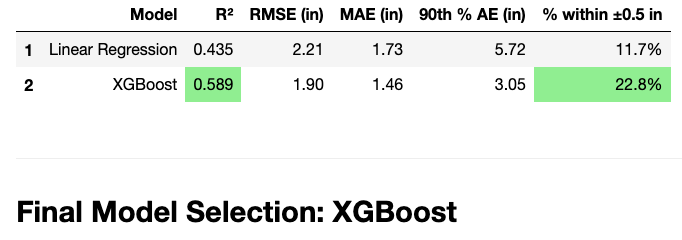
The goal of ΔiVB⁺ is to establish a reasonable expectation for how much induced vertical break a pitch should generate given how it is thrown. To do that, I trained both a linear regression model and an XGBoost model.
After making adjustments for arm slot, I compared the performance of the two. XGBoost outperformed linear regression across overall fit, average accuracy, and error metrics.
The following features were used to estimate expected induced vertical break:
- Release velocity
- Vertical Approach Angle (VAA)
- Release spin rate
- Spin axis
- Horizontal release position
- Vertical release position
- Release extension
- Arm angle, centered within delivery slot
Once expected iVB is estimated, the raw residual is calculated as:
ΔiVB = Actual iVB − Expected iVB
That residual is then standardized onto a plus scale:
ΔiVB⁺ = 100 + 15 × z(ΔiVB)
This makes ΔiVB⁺ easier to interpret across pitchers. A pitcher at 115 is not simply throwing a fastball with “good ride.” He is generating meaningfully more ride than expected given his physical inputs. A pitcher at 85 is generating meaningfully less.
What Drives Expected iVB?
After selecting XGBoost as the final model, I wanted to make sure its expectations were grounded in baseball logic.
One way to evaluate that is by examining feature importance. If the model consistently relies on variables that baseball logic says should influence induced vertical break, that's encouraging evidence that it has learned meaningful relationships rather than just arbitrary patterns.
One way to inspect what the model learned is through XGBoost's feature importance rankings. Here, I'm using the split-frequency (F-score) version, which answers the question:
Across all of the decision trees, which variables did the model return to most often when creating its decision rules?
Essentially, this version of feature importance tells us which of the model's eight features it relied on most frequently when estimating expected iVB.
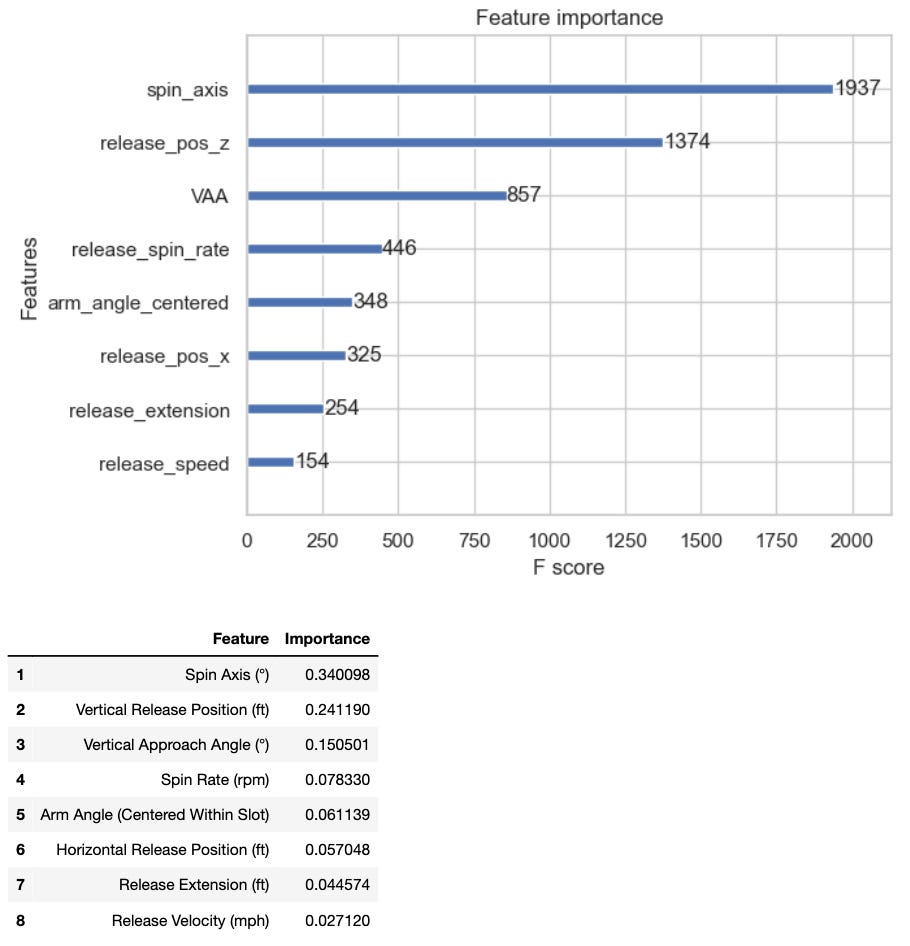
In this case, the model leaned most heavily on spin axis (~34%), vertical release position (~24%), vertical approach angle (~15%), and spin rate (~8%).
That aligns well with our understanding of pitch physics. Expected ride should depend heavily on how the ball is spinning, where it is released from, and the angle at which it approaches the plate. Velocity still matters, but once the model accounted for release geometry, spin characteristics, and approach angle, it relied on velocity much less frequently than those other inputs.
Okay, so feature importance tells us what the model leaned on. But that leaves another question: How do those variables work together?
Luckily for us, the machine-learning toolbox gives us several ways to investigate that question.
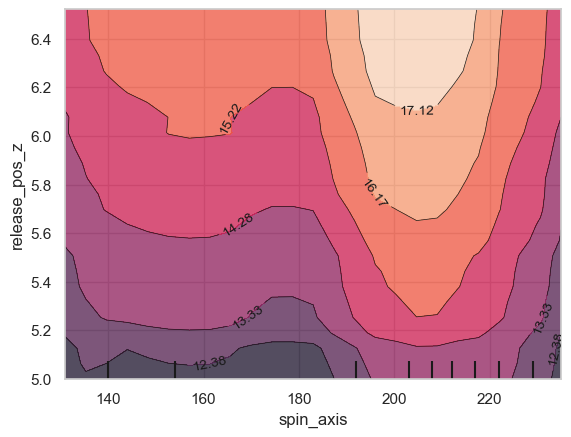
The contour plot above is a two-feature Partial Dependence Plot (PDP). Rather than showing individual pitches, it shows the model’s average expected iVB across combinations of spin axis (x-axis) and vertical release position (y-axis), while averaging over every other feature.
We could choose any combo of the eight features that make up the model. This particular pairing is interesting because, spin axis and vertical release position were the two highest-ranked important features.
The contour labels represent the model’s predicted expected iVB in inches, while the lighter regions indicate higher predicted ride.
The pattern reinforces why context matters. Higher release points consistently raise the expected-iVB baseline, but spin axis does not operate as a simple one-directional lever. Instead, its effect depends on the accompanying release feature. The highest expected-iVB region emerges when a favorable spin-axis range is paired with a higher release point.
That interaction is the point.
Expected iVB is not determined by any single physical characteristic in isolation. Instead, it emerges from the interaction between a pitcher’s release geometry, spin characteristics, approach angle, and the rest of the pitch’s physical profile.
The 2025 ΔiVB⁺ Leaderboard
No single metric can fully capture fastball quality. Even comprehensive models such as Stuff+ compress a complicated combination of velocity, movement, release traits, and other physical characteristics into one estimate. ΔiVB⁺ is not intended to replace that broader evaluation. It asks a narrower question: how much vertical ride did a pitcher generate relative to expectation?
Every new metric should create as many questions as it answers. Future work could examine year-to-year stability, expand the framework to other pitch types, and test whether context-adjusted ride adds predictive value beyond raw induced vertical break.
For now, ΔiVB⁺ is simply an attempt to evaluate ride with the context it deserves.
Sources & Further Reading
What Baseball Teaches Us About Measuring Talent - The New Yorker (Louis Menand)
https://www.newyorker.com/magazine/2019/04/08/what-baseball-teaches-us-about-measuring-talent
Paul Skenes has 5 (!) pitches -- and here’s his take on all of them – MLB.com (Sam Dykstra)
https://www.mlb.com/news/paul-skenes-pitching-arsenal-inside-lookNo. 1 Overall Pick Paul Skenes’ Overall Arsenal Should Outweigh Questions About Fastball Shape - Baseball America (Geoff Pontes)
The effect of spin on the flight of a baseball - (Alan M. Nathan)
Paul Skenes and The Blueprint for a 100 MPH Fastball with “Poor Shape” - BaseTunnel (Eli Ben-Porat)
https://basetunnel.substack.com/p/paul-skenes-and-the-blueprint-for
Stuff+, Location+, and Pitching+ Primer - Fangraphs (Owen McGrattan)
https://library.fangraphs.com/pitching/stuff-location-and-pitching-primer
Understanding Feature Importance in Machine Learning - (Lomash Bhuva)
https://medium.com/@lomashbhuva/understanding-feature-importance-in-machine-learning-d86ec50e0055
The Multiple faces of ‘Feature importance’ in XGBoost - (Amjad Abu-Rmileh)